
Should This Call Be AI or Human? Americans Draw the Line


67% of Americans want to speak to a real person when a call carries real stakes, and 47% feel that strongly. Read alone, that number could look like an AI backlash. It isn’t that clear-cut. Our survey included 2,003 US consumers and 252 US business owners, with interesting (and surprising) results. It found that 36% of Americans are comfortable letting AI handle less urgent tasks such as checking a balance, confirming store hours, or tracking a delivery. Put the two figures side by side, and a clearer pattern appears. Americans aren’t judging AI against humans in terms of ability. They’re judging it by what happens if the call goes wrong.
Comfort with AI rises and falls with consequence, not complexity. A store-hours question and a fraud alert may each take about 90 seconds to resolve. But only one carries real financial stakes, and that is where callers want a person on the line. If your business reads rising AI acceptance as proof that customers are “getting used to it,” you may be measuring the wrong thing. Consumers judge calls by risk, not by task type. Businesses that route calls to AI based on the task alone may miss what callers actually care about: what happens if the call goes wrong.
Businesses need to tell callers when AI is answering. That one change lifts comfort by 4 to 5 points in every region tested, including the Midwest, the region most resistant to AI on the phone. That’s one of the largest swings in the entire dataset, and it costs a business nothing but honesty.
Meanwhile, 53% of business owners surveyed plan to expand AI on customer calls within two years. Expanding AI is not the problem, but using it on the wrong calls is. Businesses need to match AI use to what the caller has at stake.
Fine for Store Hours, Not for Emergencies: Where Americans Draw the Line on AI
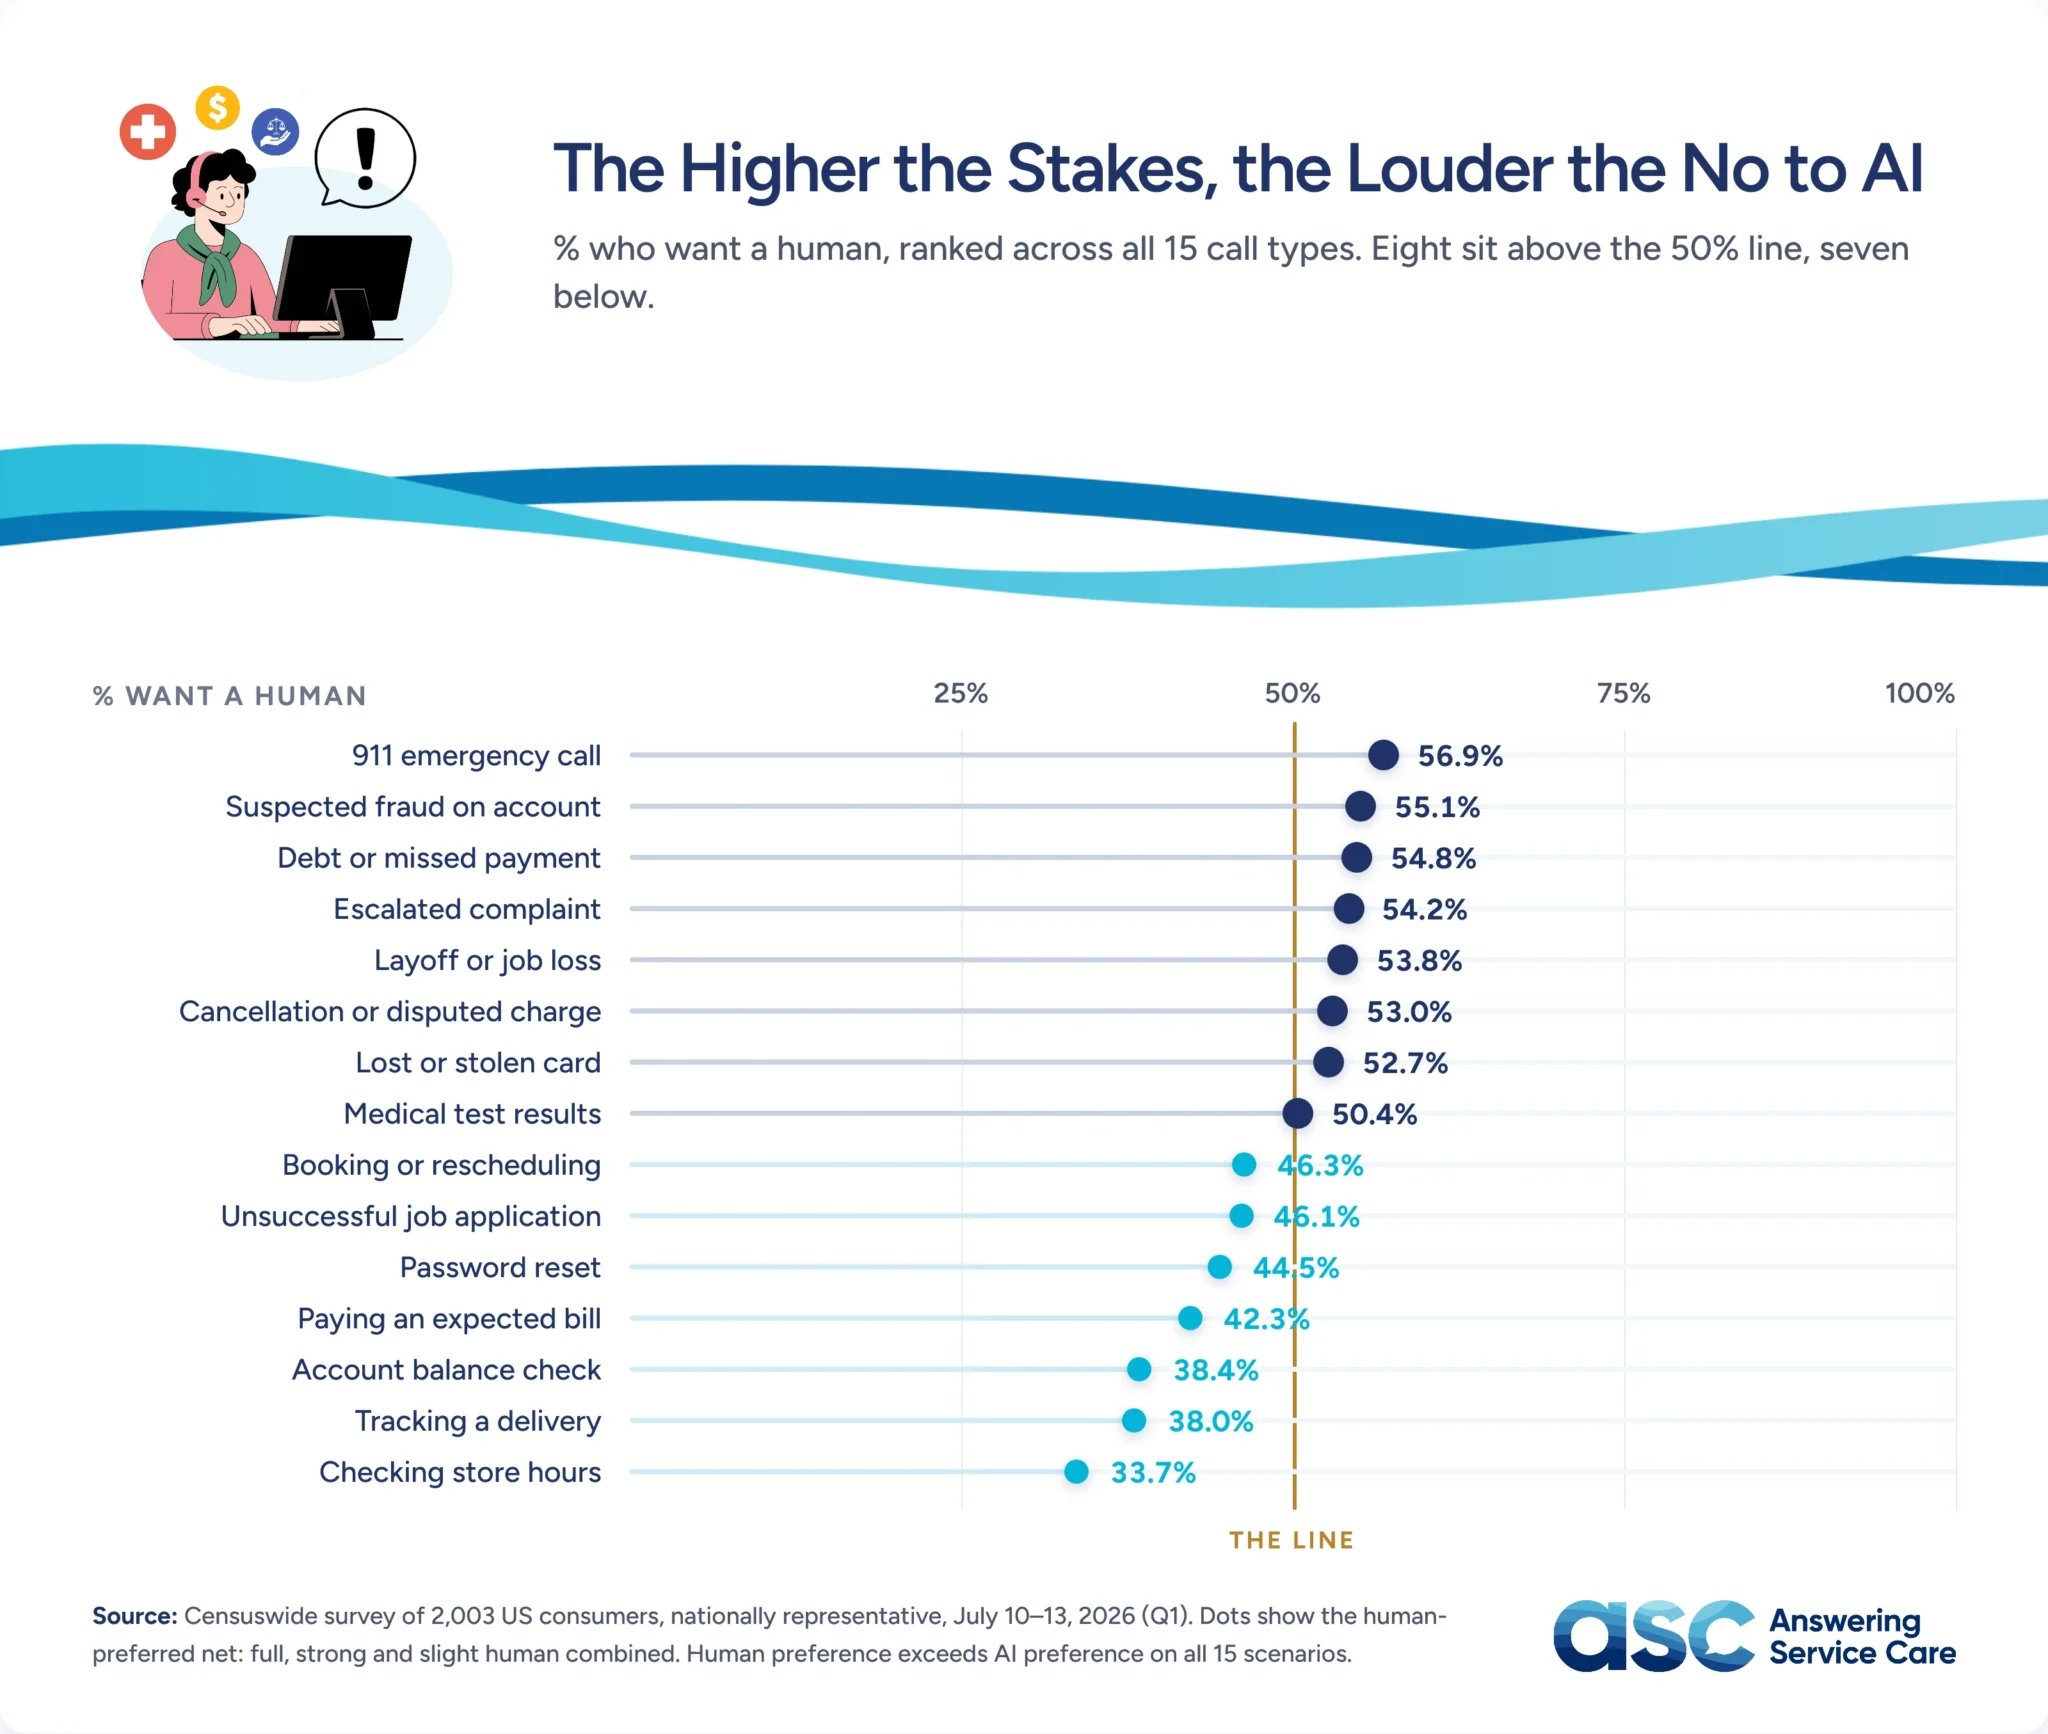
Across the 16 call scenarios tested, the line isn’t a slope. It’s a cliff. AI preference holds steady around 30% for routine tasks: store hours, delivery tracking, and bank account balance checks. Then it falls off at 911 calls (57% want a human), suspected fraud (55%), debt collection (55%), and layoffs (54%). There’s no gradual middle ground where preference shifts slowly. Callers appear to see a clear divide between tasks AI can handle and calls where a person needs to take over the responsibility.
Emergency calls reveal a more complicated divide. 22% of Americans would prefer AI to answer a 911 call. That rises to 40% among 25- to 34-year-olds, a generation accustomed to automated triage. Set against 78% of over-55s who insist on a human, and 37% of all adults who will accept nothing else, this isn’t one line Americans have drawn on emergencies. It’s at least two, split roughly by age, which means a single call flow can’t satisfy both halves of a mixed-age customer base.
People demand a human when the call involves complexity (40%), money (39%), an existing problem (38%), or accountability (36%). An AI can process a return, but it can’t be held accountable if the return goes wrong. That’s not a capability gap that a better model would close. It’s a structural nuance.
The industry ranking is worth noting for anyone running AI in a regulated or high-trust sector. Demand for human answering is highest in healthcare (38%), banking (34%), government (24%), utilities (23%), and funeral services (22%). It is much lower in retail (11%) and among phone providers (12%). That lines up closely with which industries carry the most legal and reputational exposure per call. The sectors where an AI misstep carries the highest cost are largely the same sectors where customers trust it least.
However, geography is not a significant factor, except for one scenario. Midwesterners want a human for a 911 call at 64%, against 54% in the Northeast, and 45% of Midwesterners will accept nothing but a human, against 36% elsewhere. Every other divide in the data, including hold-time patience, runs by age rather than region. National businesses have one clear regional exception to consider. Age, however, affects nearly every part of the caller experience.
Source: Answering Service Care, survey of 2,003 US consumers conducted July 10–13, 2026. Every human and AI share shown is as published; No Preference is the remainder.

The Patience Paradox: Gen Z Waits 17 Minutes for a Human, Boomers Give Up at 7
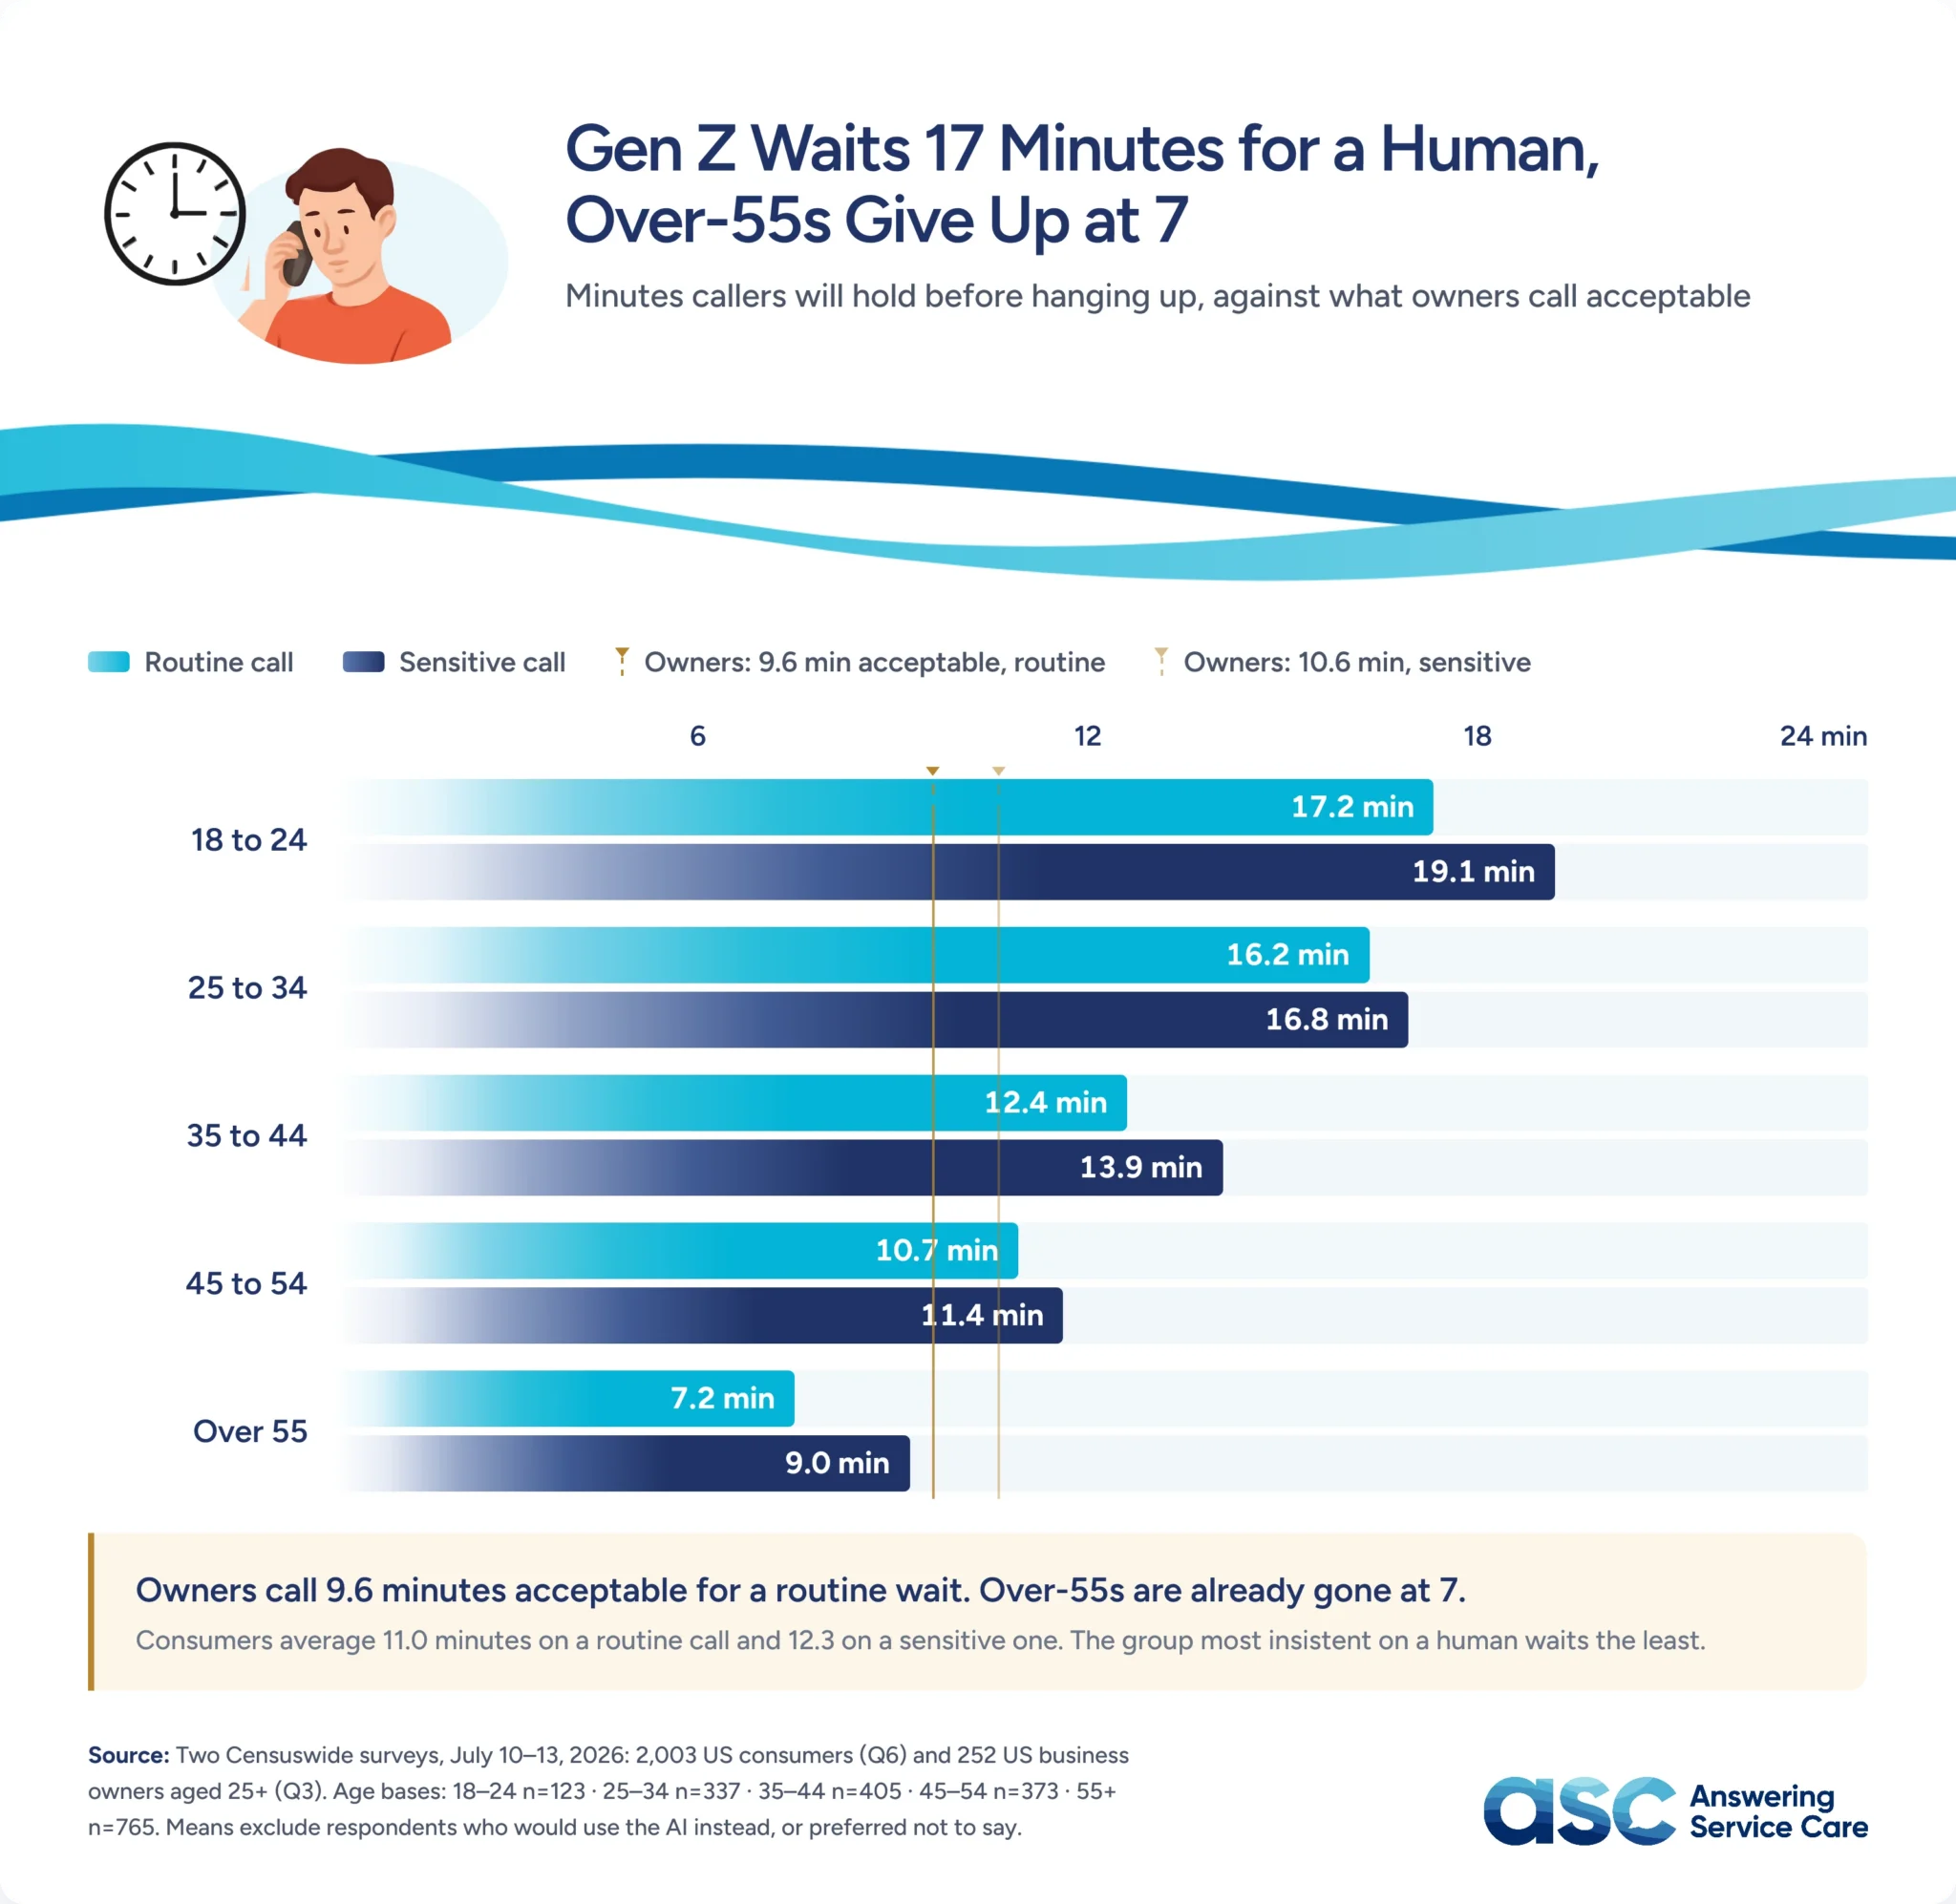
The average hold-time tolerance is 11 minutes for a routine call and 12.3 minutes for a sensitive one. At first glance, that modest increase suggests people become more patient when the stakes are higher. Breaking the average down by age shows that the conclusion alone doesn’t tell the whole story. 18- to 24-year-olds will wait 17 minutes for a routine call and 19 minutes for a sensitive one. Over-55s give up at 7 and 9 minutes, respectively. Older Americans are the most likely to insist that important calls need a human. They are also the least willing to wait for one. The group most strongly demanding human service may therefore be the most likely to abandon the call before anyone answers.
The results reflect two different expectations. Younger callers appear to treat a long wait itself as a service failure, regardless of what happens once someone answers. Older callers seem to treat the wait as the price of getting it right, worth paying when the stakes are real. There is no useful single hold-time average here. Younger and older callers have very different expectations about how long they should wait.
Business owners appear to overestimate how long both age groups will wait. They consider 9.6 minutes acceptable for a routine wait and 10.6 for something sensitive, with 23% comfortable going past 11 minutes. That benchmark does not closely reflect either age group. It is longer than many older callers will wait, but considerably shorter than the tolerance reported by younger callers.
When AI Fails on an Important Call, Only 40% Push for a Human, the Rest Scatter
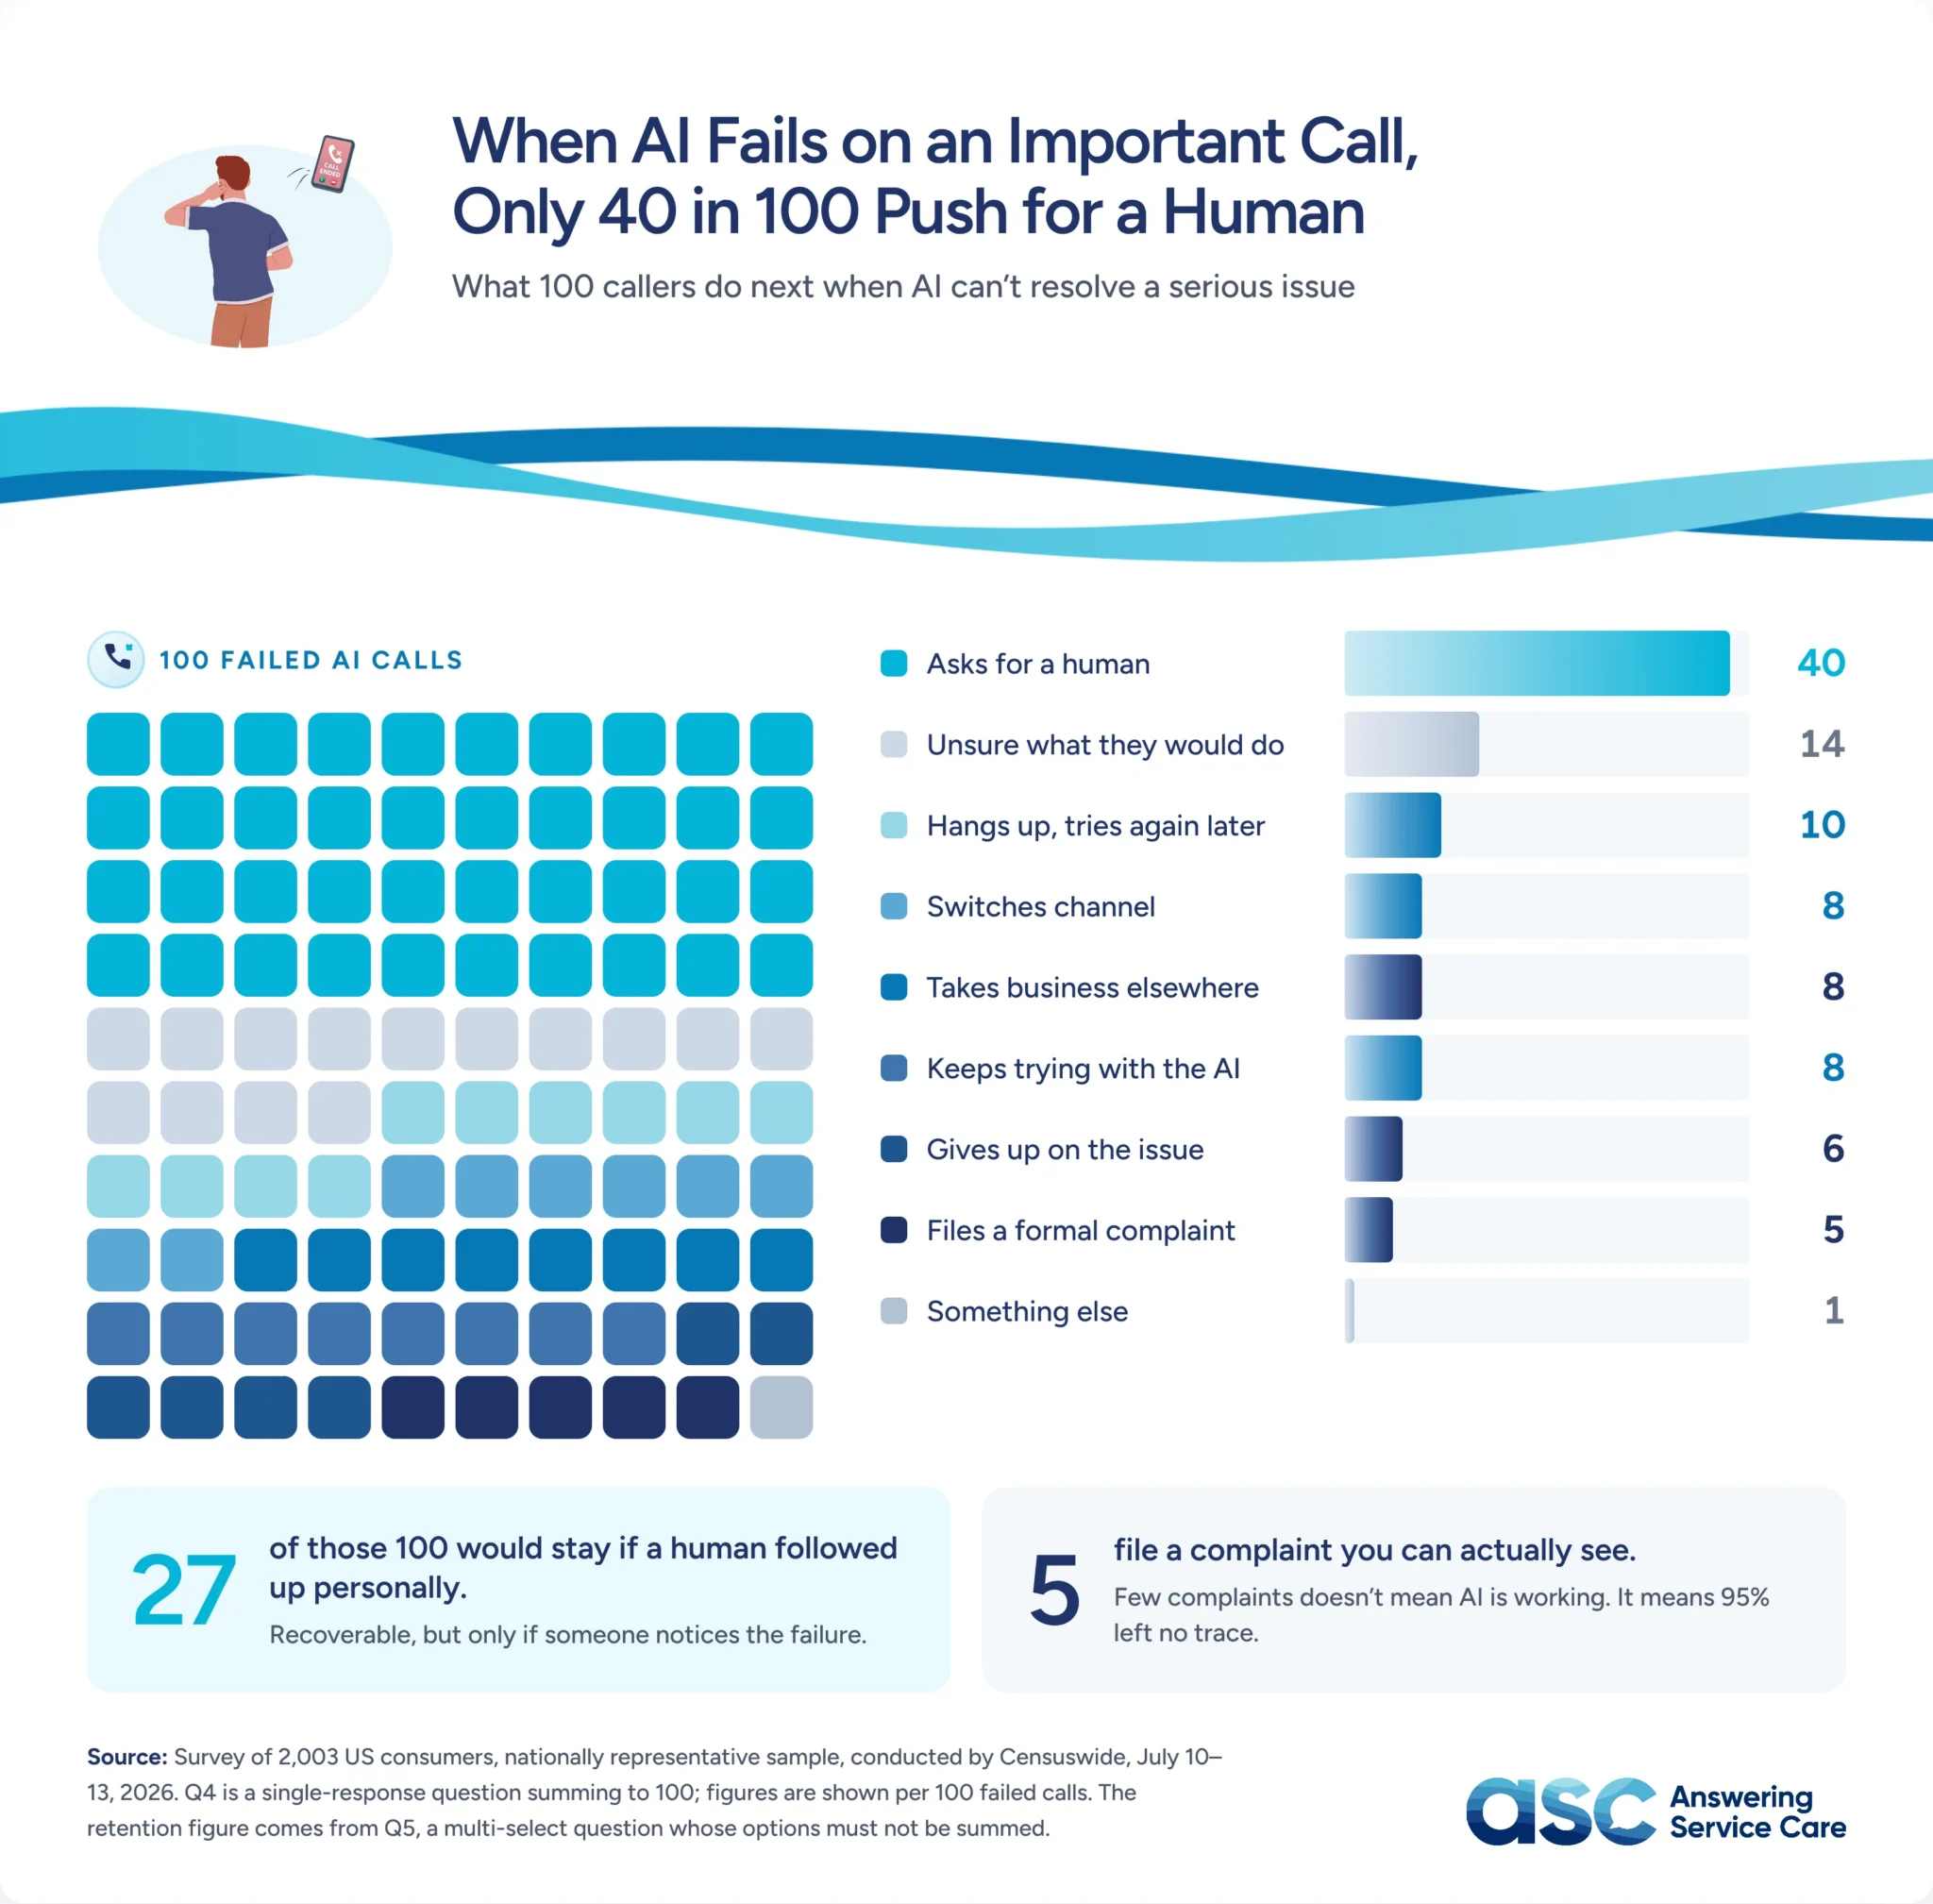
When AI can’t resolve something serious, the instinct to demand a human is weaker than the rest of this survey would suggest. Only 40% actually ask for a transfer. The other 60% take another path. Some try again later (10%) or switch channels (8%), while others give up or take their business elsewhere (8%). 6% give up on the issue outright, and only 5% file a complaint.
That 5% is significant for any business measuring AI performance by complaint volume. If only one in twenty failed calls generates a complaint, complaint data measures a small, self-selected slice of the customers a bad AI interaction actually affects. The other 95% simply don’t appear in the metrics most businesses use to judge whether AI is working, so a dashboard showing few complaints doesn’t necessarily mean AI is performing well. It may just mean that most dissatisfied customers never appear in the data.
Human follow-up gives businesses a chance to recover customers who would otherwise disappear from their data. 27% of consumers say they would stay with a company if a human followed up personally after a bad AI call. Yet most businesses have no process for identifying those customers. That’s a meaningful share of customers who say a single, well-timed phone call could win them back simply by reaching a real person at the right moment. But only if someone inside the business notices the failure in the first place, which the complaint numbers suggest most currently don’t.
A smaller group takes more visible action: 11% would leave a negative review naming the AI specifically, 12% would warn people they know away from the business, and 6% would leave for a competitor immediately. This kind of feedback tends to travel through word of mouth and public reviews before it ever reaches a company’s own channels, which is why it can be easy to miss internally.
Qualtrics XM Institute puts a national number on that exposure: $973 billion in US sales. That represents the spending consumers say they would reduce or stop after a poor customer experience.
That exposure is not distributed evenly across the country. When weighted using 2023 state consumer spending data from the US Bureau of Economic Analysis, the total is $130.7 billion in California, $82.5 billion in Texas, and $70.4 billion in Florida. In Wyoming, it is $1.7 billion. Per resident, the picture sharpens further: $2,907 on average, rising to $4,761 in Washington, DC, and falling to $2,180 in Mississippi.
That spending has not been lost yet, but it is at risk. Businesses may never hear from most dissatisfied customers before those customers cut back on spending or leave.
Where the $973 billion sits
US consumers say they would cut or stop spending worth $973 billion after a poor customer experience. Allocated by state consumer spending, here is what that exposure looks like where you operate. Hover or tap any state.
Sales at risk: Qualtrics XM Institute, Q3 2025 Global Consumer Study, allocated by state consumer spending (BEA, Personal Consumption Expenditures by State, 2023). Per-resident figures use Census 2023 state population estimates. Survey base: 2,003 US consumers, Censuswide, July 10–13, 2026.
Phone Call Anxiety Is Generational: 43% of Gen Z Find Even Routine Calls Highly Stressful
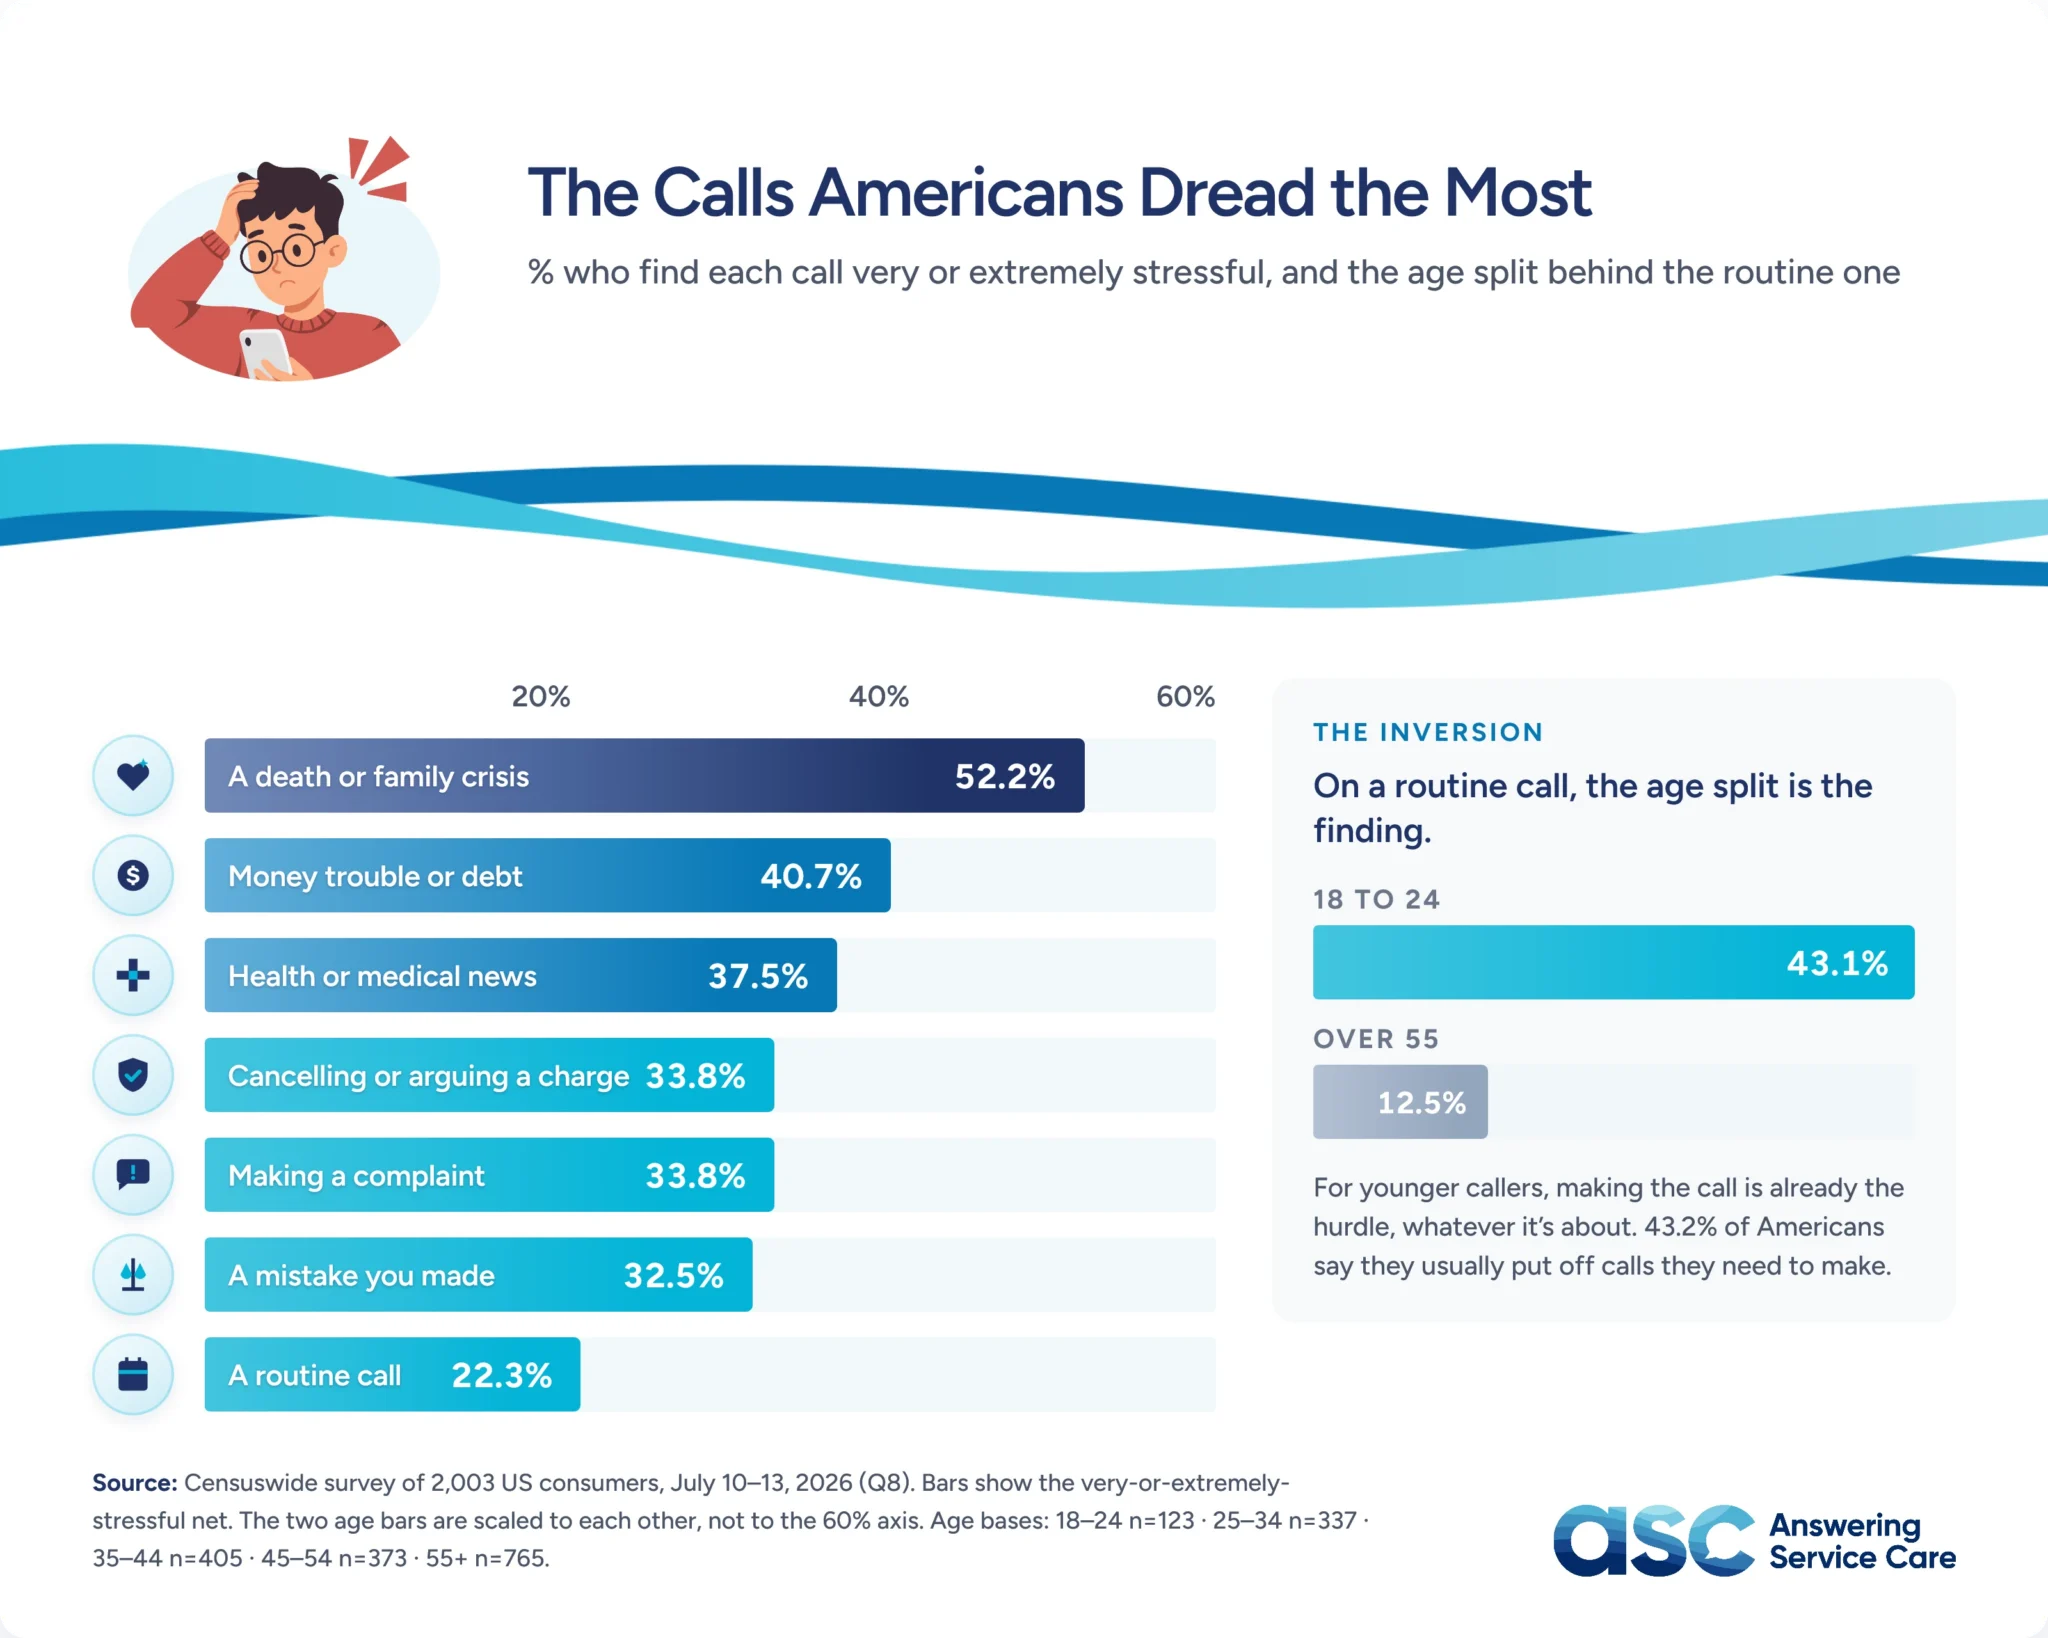
Phone anxiety rises with the emotional weight of the conversation. More than half of Americans find calls about a death or family crisis highly stressful; 41% say the same of money trouble; 38% say the same of health news. That ranking roughly matches how permanent or life-altering the news feels, a useful proxy for which calls need the most careful handling regardless of channel.
Age changes the baseline entirely. 43% of 18- to 24-year-olds find even a routine call very or extremely stressful, compared with 13% of over-55s, and 43% of Americans overall admit to putting off calls they need to make. When read alongside the hold-time data, a pattern emerges. The generation most willing to wait is also the generation most likely to find the phone itself stressful. For younger customers, making the call is already a significant hurdle, regardless of the subject.
The stress shows up in callers’ actual experiences: 18% have felt genuine anxiety, 17% have lost their temper, and 12% have cried during a business call. 21% of 18- to 24-year-olds have felt embarrassed or judged by AI specifically, five times the rate among over-55s, suggesting younger callers are more sensitive to how AI delivers a response.
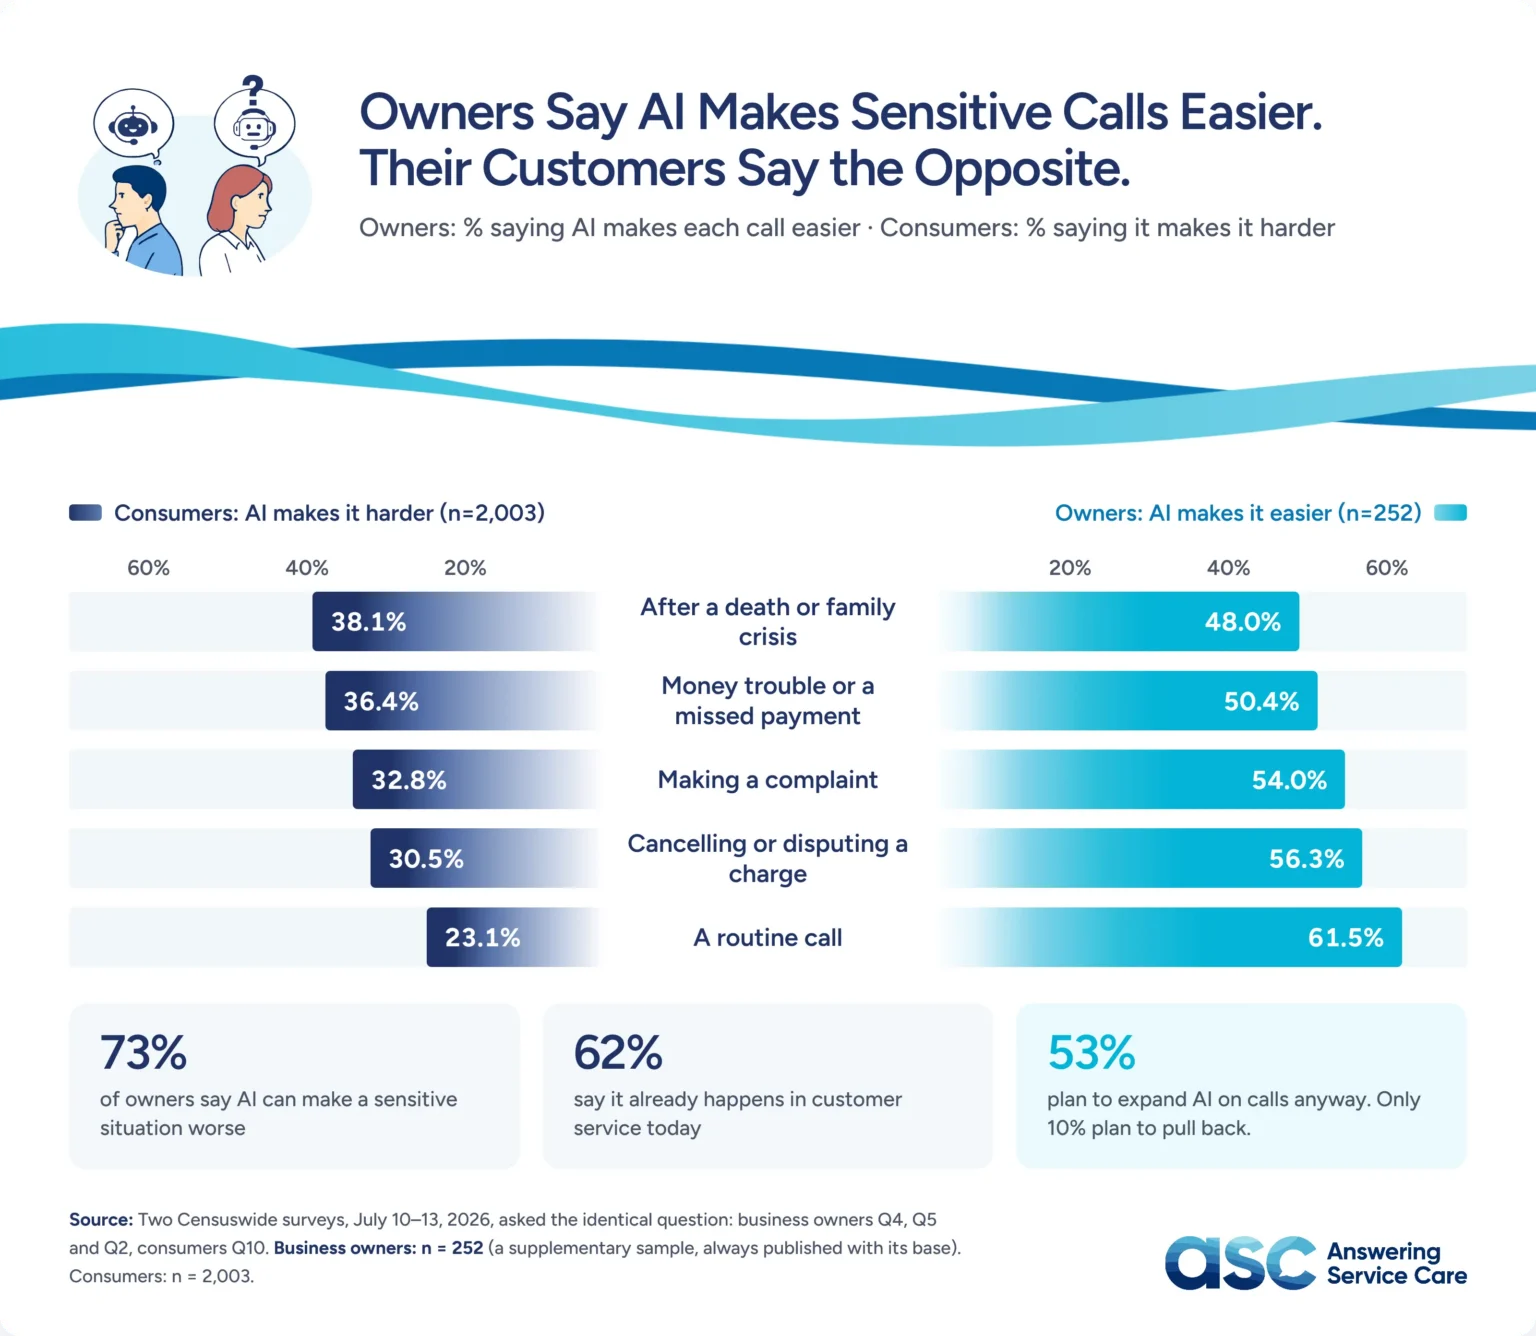
That sensitivity shows up directly in how AI performs on sensitive calls. On every emotionally weighted call type tested, more Americans say AI makes it harder than easier: bereavement (38% harder vs. 25% easier), money trouble (36% harder vs. 27%), health news (35% harder vs. 27%). Only routine calls tip in AI’s favor. AI’s biggest weakness on these calls isn’t accuracy or speed. Its tone, on exactly the calls where tone is the whole job.
The Empathy Gap: Businesses Say AI Makes Sensitive Calls Easier, Their Customers Say the Opposite
Ask business owners and their own customers the identical question, and the answers point in opposite directions. 48% of owners say AI makes a bereavement call easier, 50% say the same about handling money trouble, and 54% say the same about handling complaints. On every one of those call types, more consumers see it differently. On grief specifically, the gap nearly doubles: owners are almost twice as likely as their customers to believe AI helps. Whatever is making these calls feel easier to the business isn’t making them feel better to the person on the other end, and that’s the experience that ultimately determines whether the customer stays.
Owners aren’t unaware of the risk, which makes the pattern harder to write off as a simple knowledge gap. 63% say AI can make sensitive situations worse, 62% say it already does in their own business, and yet 53% plan to expand AI further, while only 10% plan to pull back. This is a group that has seen the risk play out directly and is still expanding AI use. The disconnect may come from what each side measures. Businesses focus on handling time and cost per call. Customers focus on empathy, accountability, and whether the problem gets resolved.
That risk is already present on the calls consumers care about most. Just over half of businesses run some AI for suspected fraud (56%), escalated complaints (52%), and emergencies (51%), the same call types where 55% to 57% of consumers want a human. The empathy gap is showing up in how businesses route calls. It’s already deployed and answering real calls for more than half the businesses surveyed.
Human-only handling is still the most common approach across all 13 call types tested. And AI-only handling never exceeds 14% anywhere. However, with more businesses planning to expand AI, that human-first default may not last.
Businesses do not have to choose between AI and human answering. AI can handle routine calls, while a trained person steps in when the caller needs empathy, judgment, or accountability.
The Future of the Business Phone Call: Where AI Works, and Where a Human Must Answer
Every dataset in this study points in the same direction. Acceptance of AI is high when little is at stake. It falls sharply as the consequences rise. Businesses, however, are expanding their use of AI at both ends of that spectrum. Better technology may not erase this gap. Customers still want someone who can take responsibility when something goes wrong.
The retention numbers turn that gap into a business case. 27% of consumers say they’d stay after a bad AI call if a human followed up personally, a recoverable share of customers that most businesses currently have no process to reach, since only 5% of failures generate a complaint that would trigger one.
A Gartner survey found that 91% of customer service leaders reported pressure from executive leadership to implement AI. And only 20% said they had reduced agent staffing due to AI. That suggests the shift is being driven from the top, rather than by the teams handling customer calls.
Gartner’s workforce forecasts point in the same direction: AI may change customer service roles without removing the need for people. In June 2025, they predicted that by 2027, half of the organizations expecting to significantly reduce their customer service workforce would abandon those plans. In the same release, a poll of 163 customer service leaders found that 95% planned to retain human agents.
Full automation may have been the goal for some businesses. However, Gartner’s research suggests many are instead moving toward a model in which AI handles routine work, and people remain responsible for calls that require empathy, context, or judgment.
“For business owners, the best customer experience isn’t AI or human. It’s the right combination of both. AI brings speed, consistency, 24/7 availability, and support in 80+ languages, while people bring judgment, connection, and empathy. The key is transparency, so customers know how they’re being served and have a clear path to a person when they need one.”
-Logan Shooster, VP of Strategic Growth, ASC.
The Line Is Drawn, the Question Is Which Side of It Your Business Answers From
Across every section of this data, the same pattern repeats. Americans sort calls by what’s actually at stake, not by how complicated the task is. AI earns trust where little rides on the outcome and loses it precisely where the outcome carries real stakes, which is also where most businesses are currently expanding it fastest.
The real cost of that mismatch is mostly invisible in day-to-day metrics. Only 5% of failed AI interactions turn into a complaint that a business can see, while 8% result in customers leaving without saying why. The calls where AI creates the most friction (grief, money trouble, and health news) are the same calls that decide whether a customer stays for years or moves on without a word.
None of this argues for less AI. It argues for a clear handoff before the customer has to fight to reach a person. That human safety net could retain the 27% of customers who say personal follow-up would keep them from leaving. That is the hybrid model, and Gartner’s workforce findings suggest more businesses are moving in that direction. The businesses that get there first are the ones drawing the line before their customers have to draw it for them.
Methodology
The findings are based on two nationwide Censuswide surveys conducted July 10–13, 2026: 2,003 US consumers and 252 US business owners (aged 25+). Supporting desk research is drawn from the Qualtrics XM Institute Q3 2025 Global Consumer Study and published Gartner research, each cited and dated on the page. Censuswide abides by and employs members of the Market Research Society, follows the MRS code of conduct and ESOMAR principles, and is a member of the British Polling Council.